Individuals
There must be KPIs for individual developers. In fact, I distinctly remember thinking the same thing when pressed by a VP who wanted to squeeze every ounce of productivity out of my team. My manager’s request was to have something like individual baseball stats (RBIs, Runs, Hits, Bases on Balls, Strikeouts). If we could measure individuals and eliminate the low performers, the rest would form a strong team. He was talking about Moneyball before the movie was released.
We can track developers by individual metrics. However, unlike baseball (or any sport), optimizing for these may have the opposite effect. An individual hitting a significant number of home runs in baseball directly impacts the win % of a baseball team. On a development squad, we aim for positive outcomes; individual KPIs may not directly reflect success in achieving these outcomes.
Boards, investors, and executives want increased efficiency, so they often arrive at the same conclusion: “Which KPIs can we use to measure the level of effectiveness of our individual developers?"
Unfortunately, that question quickly runs up against two classes of problems:
- The unmeasurable - KPIs must be measurable, and many qualities of a good developer are not quantifiable. Things like a Good cultural fit, taking on new challenges, and consistently producing good ideas are difficult to track with a tool.
- The measurable – KPIs, by nature, are measurable. Unfortunately, since developers are smart and can be cynical, they may optimize for those KPIs, skewing the results in their favor and invalidating the effort.
Regardless, management will attempt to measure engineers directly anyway. Here is a non-exhaustive list of KPIs that have been discussed (or used) in my career to measure individuals and why they were ineffective.
Individual KPIs
Lines of code per day
Lines of code (LOC) written per day, classes written per day, or commits per day are the most useless metrics to track. If a developer is rewarded for writing more lines of code, code readability will suffer. It’s trivial to turn one line of code into ten lines of code where both programs do the same thing. A developer who has done that has produced no additional functionality or value and nine extra lines of code, effectively satisfying this requirement and improving their own KPI.
Fewer lines of code written
No, I digress, this is the most useless metric. The idea is to incentivize developers to write simple, elegant code. It doesn’t work. Any average developer can reduce an entire program down to a single line of code. Also, what are we saying here, to work less?
Fewer bugs
If we reward a developer for committing fewer bugs, that same developer will have lower efficiency because they will be incentivized to become a perfectionist. Perfection is the enemy of done. Developers rated (or worse yet, rewarded) for committing fewer bugs will get less work done simultaneously, hitting their KPA and doing the exact opposite of what a board wants.
It’s also challenging to measure performance simply by bug count. What if an architect has so poorly designed a part of an architecture that bugs are easy to create, yet another part is well designed, and bugs are easy to avoid? The same developer working in those two scenarios will have a different defect creation rate, forcing us to both reward and penalize that developer.
Also, some bugs are OK to go to production. Yes, I said it. Here’s a scenario where knowingly pushing bugs to production is not just OK but required; I was on a team once where our release cadence was so slow that if we held up a release to fix minor bugs (like a UI glitch), we would have to wait an additional full quarter before shipping anything. So, we knowingly released bugs (found at the end of the sprint) for every release to make progress. Incentivizing developers to “fix bugs” would have resulted in some World Cass bike shedding.
Speed to delivery
If we reward developers on this metric, the platform will suffer from low quality. See the Iron Triangle at the end of this document.
Complex task completion
Rewarding developers who complete complex tasks is ineffective for the following reasons:
- It ignores the measurement of time, which is going to cause waste.
- Complexity, unlike time, is difficult to measure.
- Sometimes the most critical task is to write boilerplate code. Is a developer doing a necessary, but relatively simple task worth less to the team?
Customer satisfaction
Also, not a great metric. Here’s why:
- Quantifying an individual’s contribution directly to customer satisfaction is complex and error-prone.
- If I wrote a feature that customers love, but someone else wrote the deployment pipeline that delivered it to the customers, who is more valuable there? See kids’ soccer later in this article.
Adaptability
We could measure how well developers adapt to changing requirements or shifting priorities. Simply not quantifiable in a way that would be efficient to track. Essentially, this is a soft skill that a development manager would notice, but wouldn’t appear on an automated report.
By the way, book-smart developers aren’t automatically the most productive. I once worked on a team where the most brilliant person in the building was given free rein to complete a customer website. During that time, he not only failed to complete the customer website, but he was also eventually fired because he believed creating a new CRM framework from scratch would be a good idea. The new CRM framework utilized a relational database in a mathematical manner, where every cell contained fractional, compressed text and images. It was like block storage in a database. You couldn’t query it with SQL, so he also wrote his own query language. I (with my average intelligence) led my (also average) team to deliver the customer project with WordPress. It took us 3 weeks.
Peer-reviewed. Asking developers to review their peers will make a toxic, finger-pointing work environment.
Contributions.Contribution is not easily quantifiable by a tool. Individual team leads do notice contributions, though.
Summary
There is a trend here. Any KPI that measures the value of a single engineer is either difficult to measure or easily gameable. Engineering executives building large teams must rely on relationships to evaluate individuals in a software company. There is no other meaningful way to do so.
Not long ago, as the CTO of a software company, my delivery org had several squads. An absolute beast of an engineer led one squad; I’ll call him Stephen. Stephen was one of the best engineers I have ever met. Stephen was a Free Electron. Stephen was a team lead for a core piece of our architecture, and his team’s numbers were always high.
Then, one day, I sat in a scrum meeting with them, and I could not believe my eyes. Stephen was a horrible leader; he was very hard on his team. Stephen would do public code reviews and (unknowingly) embarrass his team members. He would reject a pull request, rewrite that section, and then approve it himself without ceremony or explanation. He would have senior people writing documentation. This person was a nightmare to work for— the Peter principle in full effect.
The net result (aside from the collateral personnel damage) was that his squads’ numbers did not equate to his personal level of talent as a developer. His team’s numbers were high but not the highest. Why? Because his team was afraid to submit code. They would toil forever before submitting a PR because they didn’t want to be embarrassed. Eventually, they pulled Stephen out of that leadership role, made him an official Individual Contributor (IC), and gave him projects to complete, which he did. The point is that once he left, his squad got better. Without replacing him, their velocity jumped +28%.
I always think of the Stephen story when individual KPIs come up because it is a textbook case of where removing a talented (by the metrics of any board) engineer from a team benefited the company.
Focus on teams, it’s much easier and far more effective.
Teams
The answer is simple: measure teams, not individuals.
The group over the individual
A friend who played only Soccer and Cricket while growing up in India was coaching our sons recently during a pickup soccer game, kids vs. dads. During the game, his focus was on one thing: passing. It changed how the boys thought about the game because the mindset shifted from ‘me’ to ‘us.’ Later in the game, his son scored a goal, and the boy shouted, “I scored a goal!” His dad stopped the game and said, “Don’t ever say that. Instead, say, WE scored a goal. Someone passed you the ball; they were an important part of that goal.”
Team KPIs
Part of the discussion with stakeholders who want to target individuals is making a case for focusing solely on teams.
If we focus on rewarding/punishing individuals, it breeds contempt, jealousy, and toxicity. If we focus on teams, we instill teamwork, collaboration, and inclusiveness. Punishing one person makes them feel bad, and rewarding one person makes teammates feel bad. Focus on the team.
Here are a few team-based KPIs that are both easy to track and are commonly known:
Velocity: A measure of a squad’s capacity compared to only themselves from previous sprints. Not a measure of productivity, a measure of relative capacity only.
Lead Time
Lead time starts when a staffer creates a task and ends when it is in production (or UAT). Lead time encompasses Cycle Time.
Cycle Time
The time it takes for a task to go from start to completion. Cycle time is the measure of work being done, a.k.a. productivity.
WIP
Measure and limit WIP. Work in Progress (sometimes called Waste in Progress.) WIP comes from Lean manufacturing. WIP does not add value to the customer. Limit WIP to make teams more efficient.
Defect Escape Rate %
Defects are issues found before production; bugs are issues found in production. The defect Escape Rate is the number of bugs found divided by the sum of issues + bugs.
Hit Rate Chart
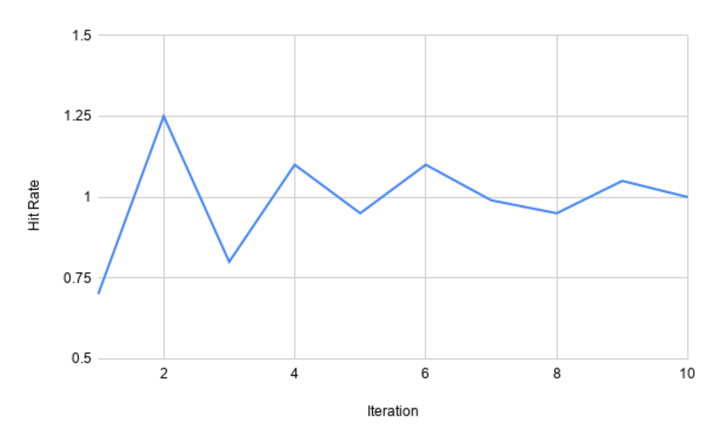
I want to focus on squad predictability for a moment.
Have a look at the Hit Rate chart above. This chart shows how predictable a team’s estimates were sprint over sprint.
- Sprint 1 - The team overcommitted and could only complete 75% of the work they thought they could.
- Sprint 2 – They learned a lesson from last time and were less confident and underestimated. So, they finished the sprint before it was over, pulled in more work, and completed 125% of the work they initially estimated. An overcorrection.
- Sprint 3 – Another slight over-commitment, but not as bad as sprint 1, and reached ~70% of the estimated work.
- …
- Sprint 10 – The team can now reliably estimate workload and be predictable.
The Estimate Reliability Chart is my favorite because it shows them coming together as a team and finding their collective velocity. We can see them becoming a team. It is a systems graph. It shows a stabilization effect based on a feedback loop. I have witnessed squads that did not have the feedback loop experiencing wild oscillations that worsen over time due to constant and more considerable overcorrections.
Team Cohesion
Something else is afoot in that Estimate Reliability Chart.
Something not directly measured but that coincides with it. As the oscillations become stabilized, what is happening is that this group of people is becoming a team before our very eyes. Individuals are finding their place within the team. Members know each other and begin to trust and rely on one another. Pre]y soon, they will know each other’s moves—like a band playing together for the 1000th. After a while, when a team is moving so fast, is in sync, and their processes mature, a funny thing happens:
They stop needing sprints.
This inflection point is the nirvana of team dynamics, and it has a name: Kanban. Kanban doesn’t have sprint planning or sprints. It’s just one continuous development project after another, with constant releases happening at will. I’ve seen it done in a few places where teams have worked together for years. Their velocity is concrete, and the squeeze has no more juice. They nearly become the machine.
Now, imagine trying to quantify to reward or punish the contributions of a single member of a squad like that. That person’s squadmates will shout you down. These types of squads are worth their weight in gold.
Also, adding a highly qualified team member to a team like that temporarily disrupts velocity and predictability. The Hit Rate Chart above will again become chaotic, defects will rise, and velocity will tank. Then, over time, the chart will stabilize as the team comes together.
Removing a team member from a highly functioning team like this also disrupts the team, and the metrics again would go haywire. Then, they would stabilize over time. The key is for them to be able to see that chart and make corrections. That’s called a feedback loop, and it is critical in team dynamics as well as systems engineering.
Not a fit
What do we say if an interviewer will not hire a candidate? We say they are ’not a fit.’ This phrasing does three things.
1. It takes the focus off the individual and indicates that they are not flawed.
2. It means they will likely fit somewhere else.
3. It emphasizes and focuses on the team dynamics where it belongs in the first place.
We can also say this if someone is being removed from a team. “John, I’m sorry, but unfortunately, after your probationary period, we feel you are a poor fit for this team.” We are simply saying that we are building a culture, and our values are not aligned. It isn’t personal; it’s just factual.
Culture is what team building is about. If we hire people who are smart and get things done and look for an excellent cultural fit, anyone who is ultimately not a good fit will be obvious. We don’t have to track them with ineffective metrics and KPIs.
Focus on output
Two scenarios:
- Team 1: Stacked with world-class developers, works 80-hour weeks, but can’t finish anything.
- Team 2: Assembled with local guys who live near the building, and although they never work overtime, they got work done.
Who’s the better team?
It doesn’t matter who the individuals are; what matters is which squad is getting work done. We measure that through metrics identified above, specifically lead time and cycle time.
Poor requirements
Agile processes should surface poor-quality product requirements. Poor requirements will restrict the development teams from realizing a relative increase in velocity.
TEAMS ARE THE QUANTA
Focusing on this higher abstraction was a paradigm shift when I was forced to reconcile it in my career. It’s a difficult concept to grasp because it feels like an excuse to either let developers run amok or to give them cover to hide individual problems.
The Iron Triangle
One easy way to communicate to stakeholders the difficulty of targeting specific developers for efficiencies is to present to them the iron triangle.
The Iron Triangle is a familiar axiom in software development, and it will hold because a board will understand the tradeoffs.
- Not Cheap: A fast and high-quality developer will not be cheap.
- Low Quality: A cheap and fast developer will produce low-quality code.
- Slow: A cheap developer who writes high-quality code will not be quick.
The answer to the board is that first bullet point: “Developers who get a disproportionately high amount of quality work done cost around $200K+ each.” That usually stops that conversation, but it’s very unsatisfying. Here’s how to address the follow-up questions:
“We plan to add disproportionate value over time. We will hire reasonably priced, above-average developers who are a fantastic cultural fit. They will undergo our training program, and a senior engineer will serve as their mentor. We will measure the effectiveness of the team they are on and create a feedback loop for that team, so they improve together. We will measure their collective successes and their collective failures in every sprint and every initiative. Success
Breeds success: over time, those squads will become tighter, more efficient, and a massive competitive advantage for this company. We will see value added to this organization every two weeks. We are not asking you to believe us; we will show you the data.”
Capability Maturity Model (CMMI)
The Capability Maturity Model (CMM) attempts to measure the maturity of an organization. There are five levels: Initial, Repeatable, Defined, Capable, and Efficient.
That first level, “Initial,” is defined as ChaoCc, ad hoc, and depends on individual heroics.
Depending on the heroics of individuals is the very definition of an immature business; therefore, a mature business would not rely on individual heroics. The focus of the individual tends to fade as a business matures. You run a mature company; measuring and depending on individual heroics is what startups do.
Cost per Story Point
Another useful metric, and a way to get leadership to focus on team dynamics and getting work done, is to tell them we can predict how much each story point from each team will cost. The calculation is easy once Velocity and Estimate Reliability stabilize. We will know the cost of the group. For example, for Squad 1, every sprint costs us $50K, and they can complete eight story points. That means every story point for Squad 1 costs $6250.
Leadership loves that kind of thing because it lets us estimate the cost of features quickly, which can directly impact the priority of your backlog.
Summary
I’ve run dozens of teams, big and small, and the most successful, productive teams I have ever led cared for each other. Your job as a leader is to foster a collaborative, collegial environment where real bonds can be made. If you do that and you get out of their way, your teams will surprise you.
Rapid onboarding of teams can be challenging. From experience, I know that cash burn can become a major source of disagreement. You can withstand the pressure from senior management and the board by outwardly emphasizing team dynamics and cohesion, while inwardly focusing on team metrics and spending.